Health Vectors
1st Floor
966, 27th Main, 8th Cross
Sector 1, HSR Layout
Bangalore 560102
(Behind Pai International)
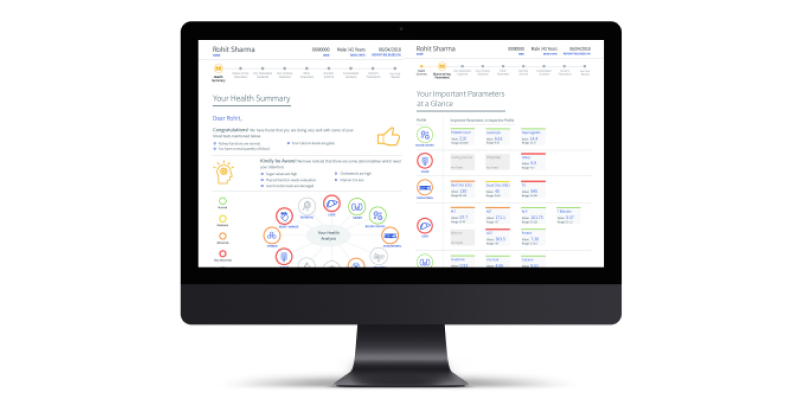
Interpreting health data doesn’t mean battling complex charts and jargon-filled reports. Smart medical reports convert complex diagnostic lab reports into accessible health narratives, acting as medical translators that anyone can understand in seconds flat. But they're much more than simplified charts—connecting the dots across health data to support better decisions and long-term well-being.
Unlike static traditional lab reports that require Googling medical abbreviations, modern Health Vectors’ Smart Reports package numbers through three game-changing elements:
Let’s start by exploring the different types of smart reports available.
Health Vectors offers different types of smart reports for health, each designed to provide varied health data inputs and depths of analysis. Whether a preliminary snapshot or in-depth chronic risk insights, these tailored formats eliminate guesswork by maximising insights based on the available information.
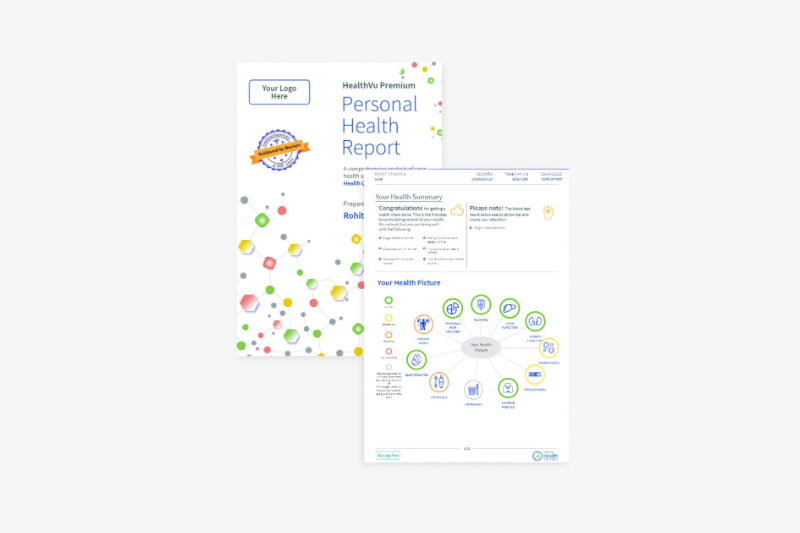
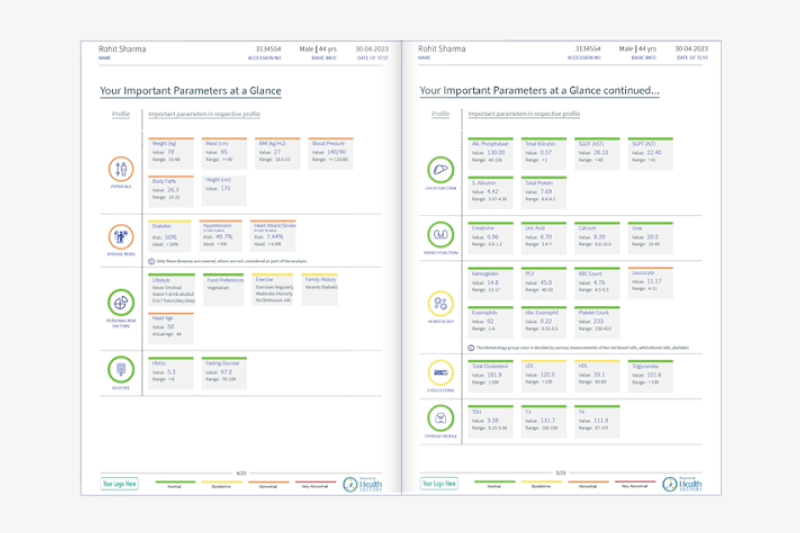
The HealthVu Premium Report uses blood data, physical exam results, and personal health questionnaire responses to assess current health status while projecting future health risks. It maps personalised mitigation pathways alongside clinical guidance, making it ideal for preventive planning.
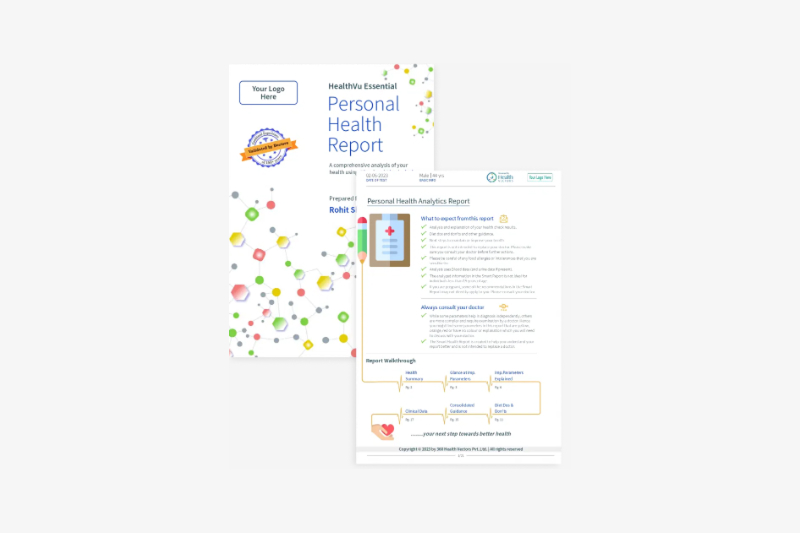
Mostly for health check packages, the HealthVu Essential Report is created only using blood and urine data. Its concise format helps busy professionals quickly grasp liver function trends, kidney efficiency benchmarks, or cholesterol management indicators without technical overload.
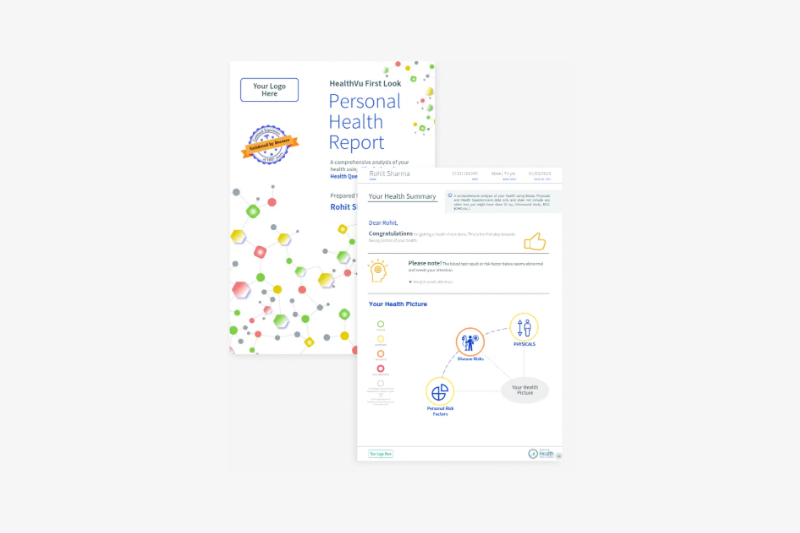
Need instant basic insights? The HealthVu First Look Report benchmarks wellness using only quick personal questionnaire responses, which is ideal when only a preliminary health position is needed. It is an evidence-based tool used before committing to full diagnostics.
Also Read: Can Smart Medical Reports Predict Chronic Disease Risks: Explained
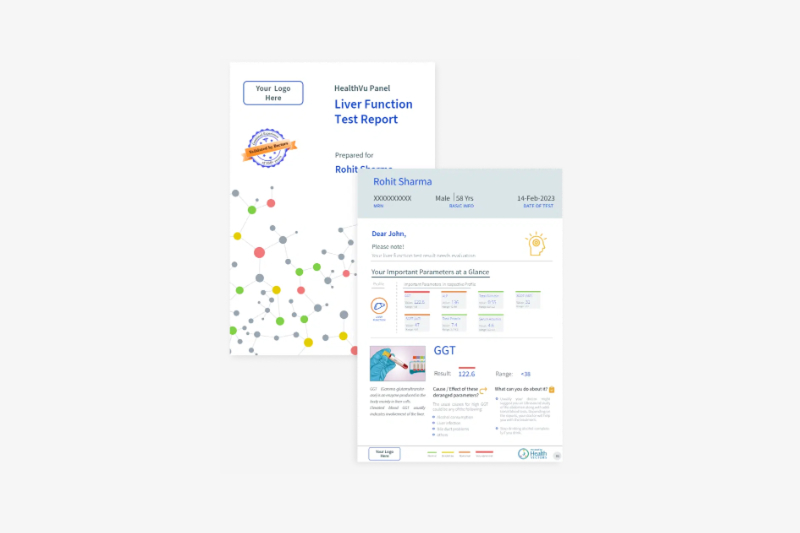
Like other information, knowledge about organ functions is essential for better well-being. The HealthVu Panel Report provides targeted health insights by analysing specific organ functions or biochemical markers in clusters. These reports are created with individual panels like LFT, KFT, lipid profile, etc.
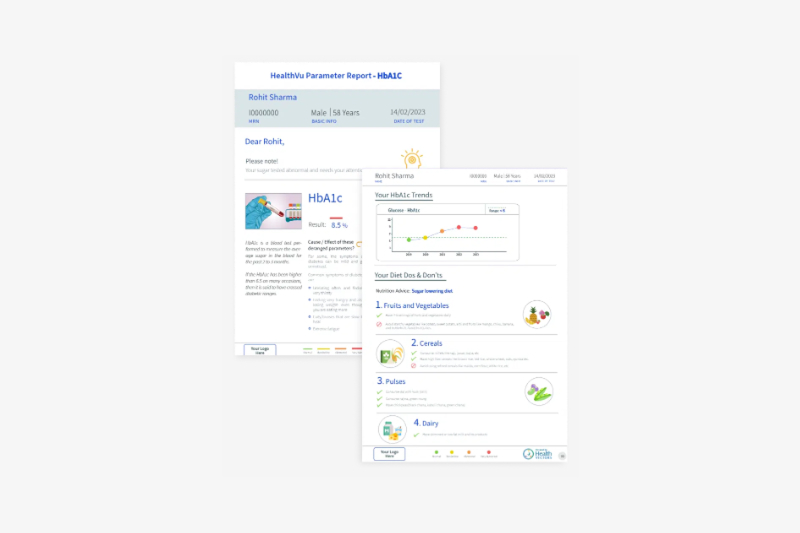
The HealthVu Parameter Report focuses on a single health indicator, offering a deep dive into a specific biomarker’s trends and implications. These reports are created for individual parameters like TSH, vitamin D, etc., helpful in tracking isolated factors that play a critical role in health management.
Understanding the optimal smart report type for patient health analysis is the first step for healthcare providers. This knowledge allows them to suggest the most appropriate report for their patients’ needs.
Let’s explore their chronic disease management and prevention superpowers next.
To provide patients with deeper insights into their health trajectories, smart reports analyse both clinical data and lifestyle patterns to forecast risks for chronic conditions like diabetes, hypertension, and cardiovascular disease (CVD). These reports map hidden correlations between a patient’s biomarkers and potential complications for more informed clinical oversight.
Why does this matter?
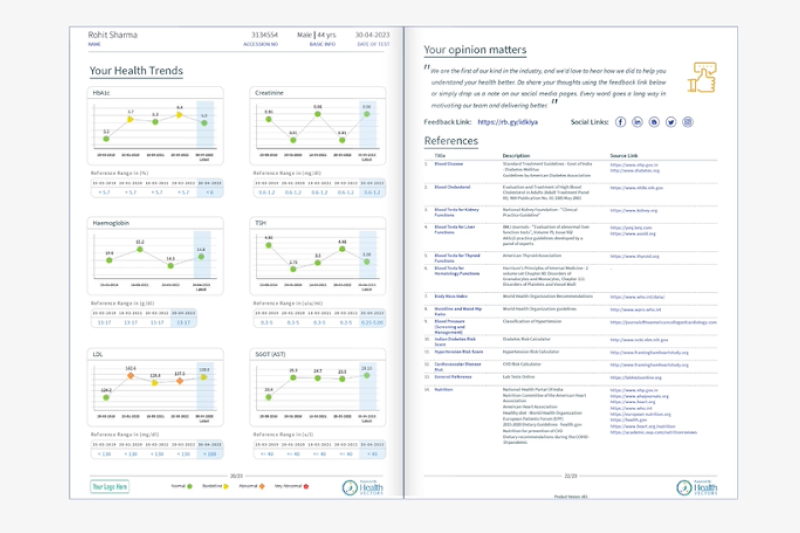
Predictive insights become essential when managing conditions requiring proactive care. Imagine tracking blood glucose trends over six months through a smart medical report—sudden spikes trigger automatic alerts, while stabilised readings unlock tailored dietary suggestions.
Three pillars make this possible:
Let's see how these principles work in practice:
Beyond clinical data, smart reports increasingly assimilate metrics, creating 360° prevention pathways—a vital bridge to our next discussion about tech-enhanced diagnostics.
Smart reports for health are designed to bridge communication gaps between healthcare providers and patients through medically accurate, easy-to-digest insights. By transforming technical data into clear narratives, these reports foster shared decision-making—like having a health translator that speaks both "medical expert" and "everyday concern".
Medically accurate smart lab reports deliver insights in plain language while maintaining clinical precision:
Traditional lab analyses require providers to manually explain data nuances; automated insights in modern reports instead highlight critical patterns needing discussion. Three collaboration benefits emerge, thanks to smart reports:
Such automated insights pave the way for meaningful health conversations rather than one-sided monologues about "normal ranges".
By adopting Health Vector’s Smart Health Reports, healthcare providers now position themselves as leaders in patient-centric care and proactive health management.
Our advanced healthcare analytics solutions transform raw diagnostic data into actionable insights by leveraging predictive analytics to identify risks early. Presented in user-friendly formats, our solutions support proactive steps to help prevent chronic diseases.
Want to experience how our smart reports can improve preventive care? Schedule a demo with us today!
Health Vectors
1st Floor
966, 27th Main, 8th Cross
Sector 1, HSR Layout
Bangalore 560102
(Behind Pai International)